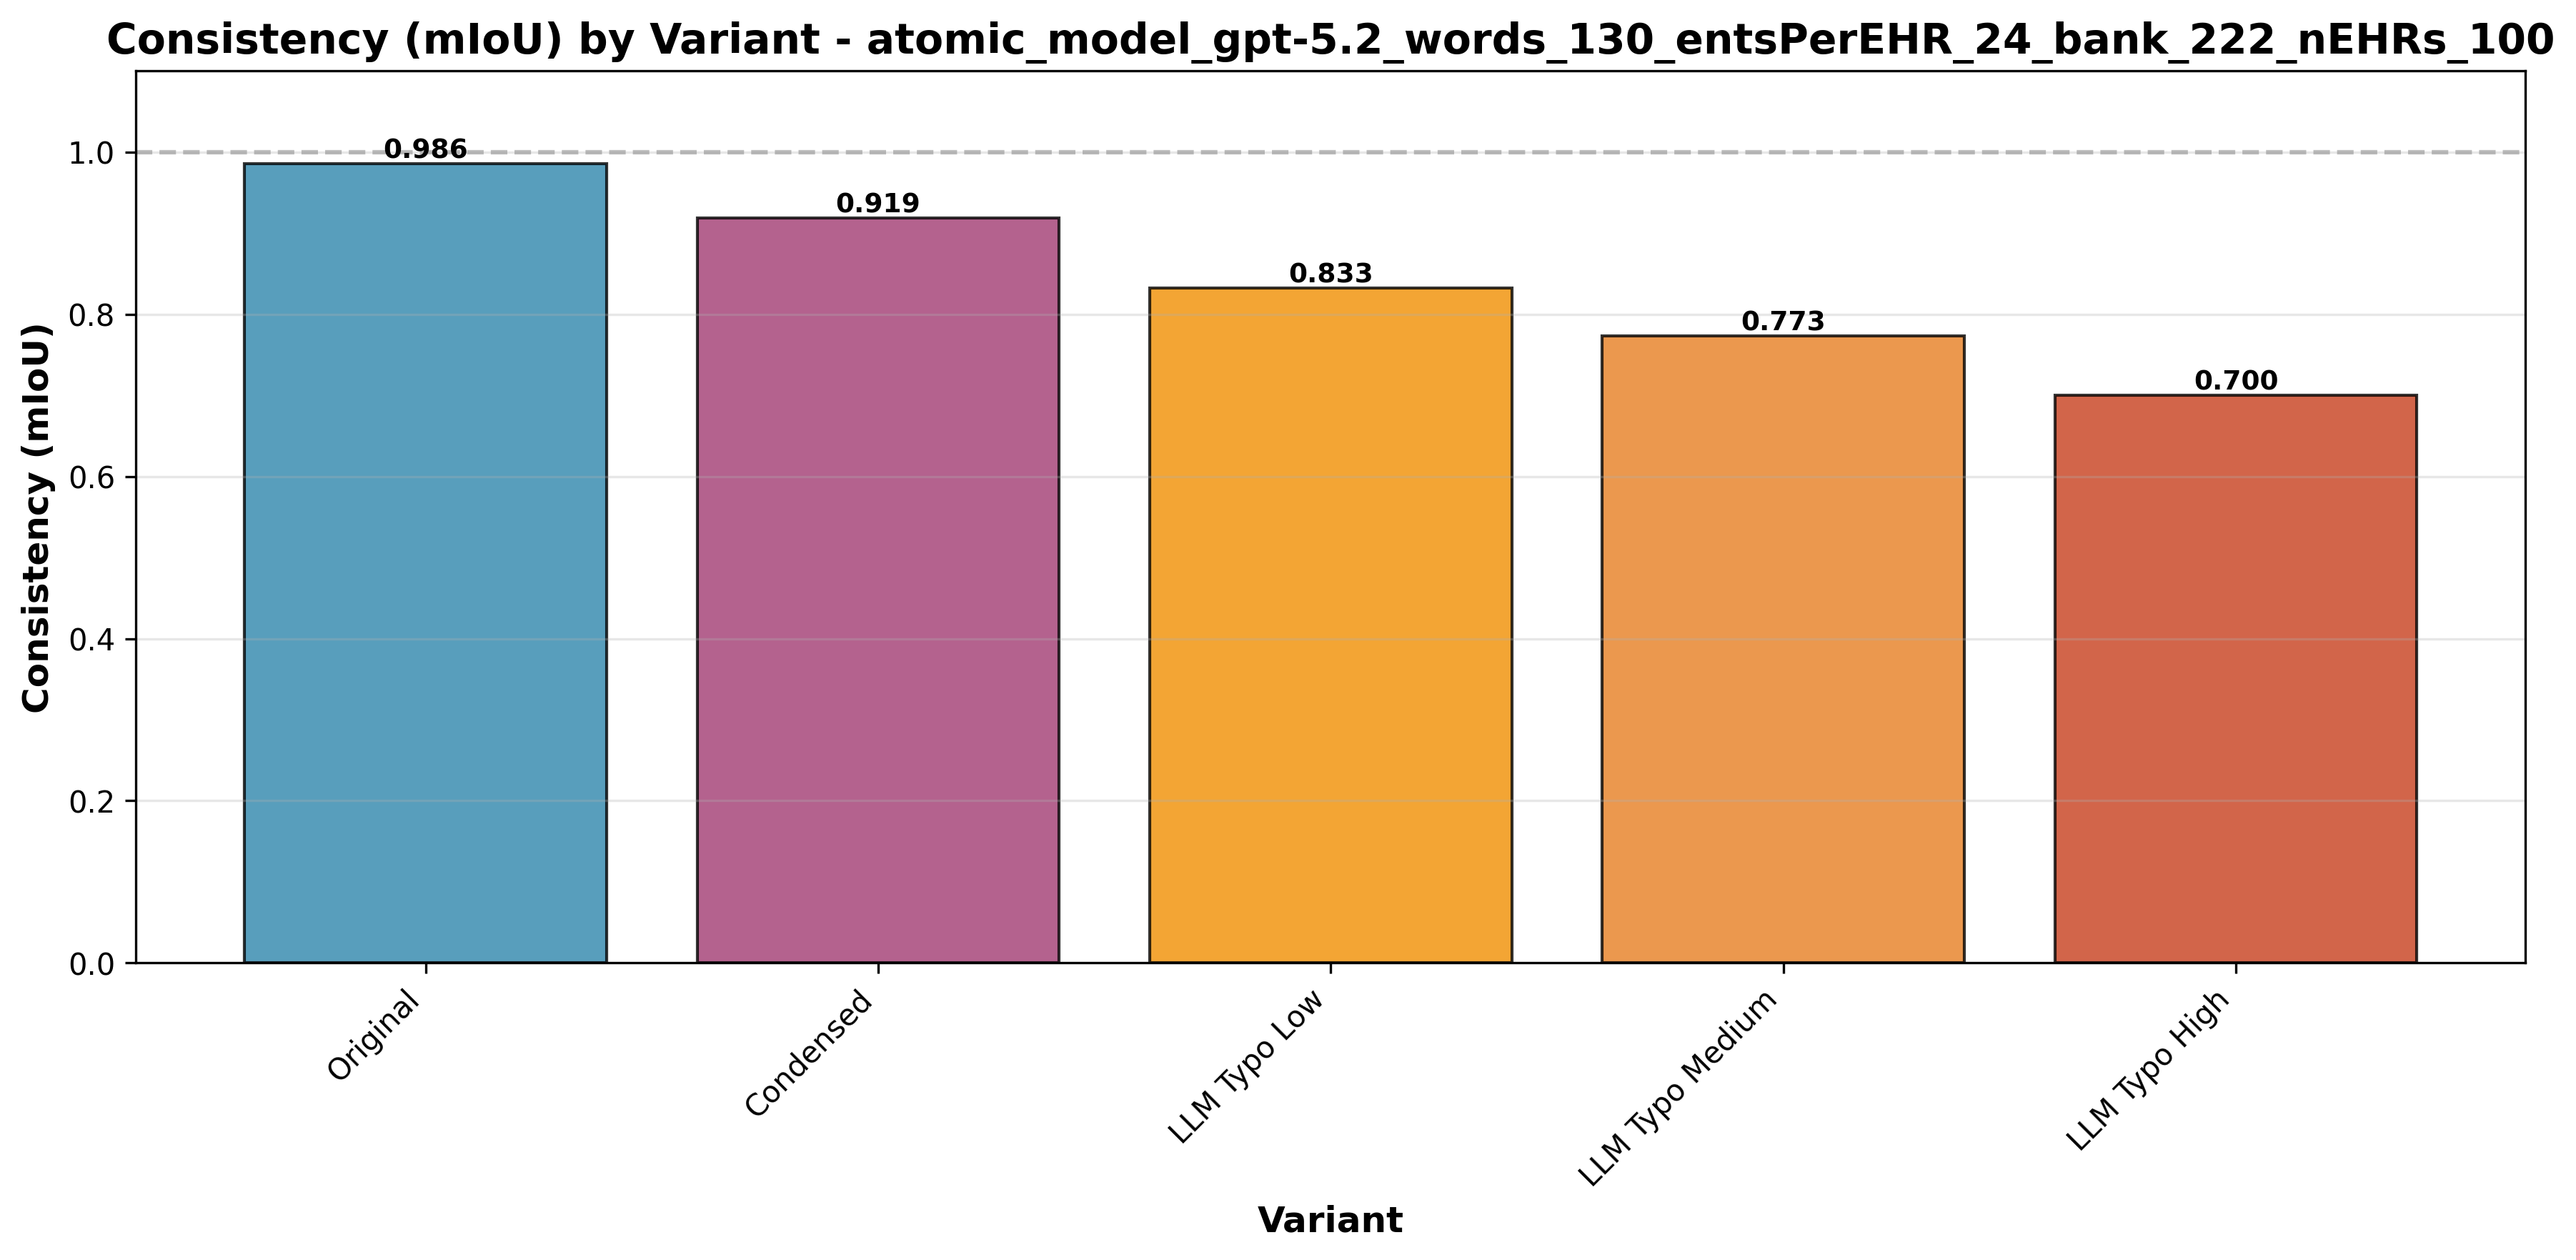
Figure 16: Consistency Comparison between five EHR variants. The model shows near-perfect reproducibility on Original and Condensed datasets.
Striata turns hospital managers and clinicians into a data team of one. It answers high-complexity questions about pathways, costs, outcomes, revenue, and operations in minutes — powered by a Data Engine that standardizes unstructured clinical notes into analysis-ready data, enabling large-scale observational research and regulatory-grade RWE (Real World Evidence).
Benchmarks show 97.8% recall on clinical entity extraction from unstructured EHRs, 100% recall on lab (name, value, unit) triplets, and Striata completes 36/36 end-to-end analytics benchmark questions in ~3–4 minutes per question.
For a hospital, this means the notes you already have can finally answer the questions you’ve been carrying for years — so you can improve workflows and redesign patient pathways that have been stuck for decades.
Hospitals run on decisions: which pathways are working, where the bottlenecks are, what care actually costs, and which interventions improve outcomes. Yet in most systems, answering even “simple” operational or clinical questions still requires weeks of analyst time, multiple IT tickets, and brittle dashboards that break the moment the question changes.
Amorphous AI is building the analytics layer hospitals have been missing: software that can ingest messy, real-world healthcare data and reliably turn it into answers decision-makers can act on.
Striata, our AI data analyst, turns every hospital manager and clinician into a data team of one.
Any question about patient pathways, costs, outcomes, revenue, or operational performance that used to take weeks can now be answered in minutes.
Concretely, here are the kinds of questions Striata is designed to answer — and who inside the hospital typically needs them:
This matters because hospitals already have the data — they just can’t use it fast enough. A typical hospital generates around 50 petabytes of data annually, yet estimates suggest 97% of this valuable information remains unused.
Consequently, only a small fraction of the data drives evidence-based decisions in healthcare facilities. Over time, this compounds into avoidable cost, preventable harm, and missed opportunity. There are two main challenges that make it difficult to use health data to drive decision-making:
Amorphous AI offers clients access to two key technological components:
In this white paper, we explain both technological components and our early results from benchmarking their accuracy and consistency.
Figure 1: High-level overview of the Amorphous AI Data Engine and Striata pipeline.
Next, we explain how Striata works.
Once clinical notes have been converted into clean, standardized data, the main challenge — and opportunity — is turning that data into answers to high-complexity questions. Striata is built to do this reliably: translating ambiguous, cross-cutting operational and clinical questions into auditable analyses over millions of rows of historical and real-time hospital data.
Striata is our deep analytics platform built for this task.
Think of Striata as a team of data scientists with clinical training. It is composed of specialized agents for planning, exploration, code generation, validation, visualization, and communication. A central orchestrator coordinates this workflow, iteratively selecting the next agent based on the evolving state of the analysis until the task is complete.
Figure 2: Striata behaves like an orchestrated “agent swarm.” The orchestrator selects the next agent based on current state.
Figure 3: Two plausible routes for different tasks. Striata’s orchestrator will take different paths depending on what data and type of analysis is required.
Before Striata touches any data, it nails down what the question really asks: the cohort of patients, the time window, the metric analysed, and what counts as basic units of analysis (per patient, per encounter, per observation, etc.).
| 186431008 | Clostridioides difficile infection | SNOMED CT |
| 7646 | Omeprazole | RxNORM |
| 283742 | Esomeprazole | RxNORM |
| 40790 | Pantoprazole | RxNORM |
| 17128 | Lansoprazole | RxNORM |
Figure 4: Umbrella clinical terms in the user's prompt are resolved to precise codes via graph traversal of standard medical ontologies.
Striata works against real industry-grade schemas. A key design choice is to reduce first: generate queries that extract only the rows and columns needed to answer the question, producing a salient dataset that is fast to analyze.
A typical FHIR database can hold millions of rows across dozens of tables (FHIR defines 126+ resource types) even for a few thousand patients. Identifying the right data is akin to finding a needle in a haystack.
Figure 5: Striata identifies the tables needed for the current question, then generates SQL queries to extract a dataset for analysis.
Once the reduced dataframe exists, Striata generates analysis code focused on the question and executes it in a controlled environment. The output is a structured report: an Answer Summary (output of the analysis) and a Method Summary (how Striata computed it).
Hospital discharge summaries • Question: Troponin elevation analysis
Figure 6: Striata produces executable analysis code and a structured written summary, backed by saved artifacts.
For Striata to be useful, the underlying data lake it runs on needs to contain sufficient clinical and operational signal. Much of that signal is locked in unstructured (or semi-structured) EHRs. These documents are rich in detail but difficult to search, analyze, and report at scale.
The data engine exists to unlock it: we convert that information into standardized, interoperable data without losing clinical nuance.
Consider an EHR note that says: "Patient has been recommended to discontinue metformin treatment after 3 weeks."
Capturing that in structured form is hard: you need to capture "metformin" as a medication, the recommending tone of the statement, discontinuation as an action, and the duration.
Doing it once is easy; doing it reliably over millions of documents with varying formats, abbreviations, languages, and typos is very hard.
The engine is built to be robust to imperfect inputs: to capture meaning first and to standardize second. That design choice protects against data loss and makes the output useful for clinical analytics, operations, research, and downstream AI agents.
Figure 7: High-level data flow from unstructured input to standardized output.
We begin by normalizing source documents (PDFs, scans, text), extracting basic metadata (patient, note, dates), and detecting language. The engine builds a note-specific abbreviation glossary so short forms like "HTN" (i.e. Hypertension) can be resolved safely.
Figure 8: Detailed agent flow for Stage 1 processing.
It then uses a large language model to extract clinical entities (conditions, medications, labs, procedures, etc.) according to a proprietary data model with 14 focused entity types. This "capture first" step prioritizes completeness over early standardization.
Every extracted entity—regardless of type—inherits a core set of attributes to ensure consistent metadata, temporal grounding, and provenance tracking.
| surface_text | str (Exact snippet from source text) |
| normalized_phrase | str (Canonical English term) |
| temporal_context | Enum: ACTIVE | RECENT | CHRONIC | HISTORICAL | PLANNED |
| certainty | Enum: CONFIRMED | SUSPECTED | RULED_OUT |
| negated | bool |
| clinical_relationship | Enum: PRIMARY | SECONDARY | RISK_FACTOR | COMPLICATION |
Entities are not isolated; they are linked to form a semantic graph of clinical concepts.
| body_site_entity_ref | Links finding to anatomy (e.g., "Rash" → "Left Arm") |
| caused_by_entity_ref | Causal link (e.g., "Anemia" → "Bleeding") |
| reason_for_entity_ref | Justification link (e.g., "Ibuprofen" → "Pain") |
| evidence_entity_refs | Supportive evidence (e.g., "Pneumonia" → ["Cough", "Fever"]) |
Each of the 14 entity types extends the common schema with domain-specific attributes. For example, the Medication entity captures detailed prescribing information:
Medication Entity Schema| medication_status | Enum: PRESCRIBED | ADMINISTERED | DISCONTINUED |
| quantity_value | float | str (Strength/Dosage) |
| quantity_unit | str (e.g., "mg", "tablets") |
| medication_form | str (e.g., "patch", "suspension") |
| administration_route | str (e.g., "oral", "intravenous") |
... plus 13 other specialized schemas for Condition, Procedure, Observation, Immunization, Allergy/intolerance, Device, Social history, Family history, Specimen, BodyStructure, ClinicalEvent, and more.
During Stage 2, the engine matches each entity against a pre-generated text embedding of the appropriate ontology to retrieve candidate codes, before running an LLM-based quality control step to ensure the most clinically relevant code(s) are selected.
Figure 9: Stage 2 ontology routing logic. Each clinical entity type extracted in Stage 1 is routed to the appropriate terminology system.
For each entity, the engine generates embeddings, retrieves candidate codes from a vector store, then runs an LLM-based quality control routine to select the best code(s).
Our core dogma at Amorphous AI is benchmarking-driven development. Testing AI in healthcare for accuracy and consistency is a major bottleneck — demos on five examples are easy; reliable systems at scale are hard. We do not ship improvements unless we can quantify impact on accuracy and latency. Below, we show some of the results from benchmarking our data engine and Striata.
To rigorously test the Data Engine, we built a dedicated benchmarking pipeline. The fundamental challenge in healthcare NLP is the absence of labelled ground truth — real clinical notes cannot easily be annotated at scale. Our in-house pipeline generates realistic synthetic data where we control the ground truth from the start. Reach out if you would like to give it a try.
The generation process has three distinct phases (exemplified for an experiment where we generated 500 synthetic EHRs):
Figure 10: The synthetic data generation pipeline creates labeled test data with known ground truth.
We evaluate extraction quality using Recall (fraction of ground truth entities found) and IoU (Intersection over Union) (character-level overlap between predicted and ground truth spans). We use a relaxed matching strategy (±5 character tolerance at span boundaries).
Since all extracted entities are subsequently mapped to standardized clinical codes (SNOMED CT, LOINC, ICD-10, RxNorm, etc.) in Stage 2, minor span boundary differences have no clinical consequence—e.g., "Type 2 diabetes" and "Type 2 diabetes mellitus" both map to the same SNOMED CT concept. This approach better reflects what matters in practice: did we correctly identify the clinical concept?
Our benchmarking dashboard includes "OVA" (Observed vs. Actual) visualizations that allow developers to inspect individual documents. Ground truth entities are shown with colored underlines; extracted entities appear as highlighted overlays. This makes it immediately obvious where the engine succeeds and fails.
Patient presents with Conditionshortness of breath and Missedmild chest pain.
History of ConditionHTN. Currently on MedicationLisinopril 10mg daily.
Labs show Observationelevated troponin.
Figure 11: OVA visualization example. Green highlight = True Positive (correctly extracted). Red underline only = False Negative (missed by the engine).
Our most comprehensive benchmark used 100 synthetic EHRs with approximately 2,300 ground truth entities, tested across 5 text variants. The table below summarizes the overall performance.
| Text Variant | Recall | Mean IoU |
|---|---|---|
| Original (Clean) | 97.8% | 98.2% |
| Abbreviated | 95.0% | 95.8% |
| Typo - Low | 86.4% | 96.2% |
| Typo - Medium | 78.9% | 95.5% |
| Typo - High | 71.1% | 96.0% |
Figure 12: Summary metrics across all text variants.
For a hospital, this means the engine is accurate enough for most high‑value analytics use cases (cohorting, registries, reporting) — and when it isn’t (OCR/typos), we can quantify it.
Aggregate metrics hide important variation across entity types. Some categories are inherently easier to extract than others. The chart below shows recall by entity type on unmodified text.
Figure 13: Recall by entity type (unmodified text). Core clinical entities achieve >99% recall.
Real clinical notes contain typos, abbreviations, and OCR errors. We systematically tested how noise affects extraction accuracy. The following table shows per-entity recall across noise levels.
| Entity Type | Original | Condensed | Typo Low | Typo Med | Typo High |
|---|---|---|---|---|---|
| Allergy/intolerance | 100% | 100% | 86.6% | 73.2% | 69.3% |
| Condition | 99.1% | 89.7% | 79.7% | 69.8% | 66.5% |
| Medication | 99.1% | 99.7% | 88.7% | 79.6% | 76.5% |
| Observation | 95.7% | 91.5% | 80.7% | 71.9% | 63.1% |
| Procedure | 86.4% | 72.1% | 64.3% | 61.6% | 55.5% |
| Family history | 73.6% | 57.8% | 63.9% | 45.8% | 42.3% |
| Social history | 87.6% | 72.5% | 57.1% | 51.0% | 34.7% |
Figure 14: Recall degradation by entity type as text quality decreases. Medications are most resilient; social history degrades fastest.
When the model finds an entity, how precisely does it capture the boundaries? We measure this with Intersection over Union (IoU)—the character-level overlap between predicted and ground truth spans.
| Allergy/intolerance | 100.0% (perfect boundaries) |
| Condition | 99.7% |
| Medication | 99.6% |
| Immunization | 99.0% |
| Device | 98.8% |
| Observation | 98.8% |
| Social history | 96.9% |
| Procedure | 94.8% |
| Specimen | 94.3% |
| Family history | 92.2% |
All IoU scores exceed 92%, meaning when we find an entity, we capture it accurately. The slightly lower scores for procedure and family history reflect boundary ambiguity (e.g., should "laparoscopic cholecystectomy" include "laparoscopic"?).
We evaluated the optional "Review Pass" agent—a second-pass extractor that re-reads the document to catch missed entities:
| Text Variant | Recall (No Review) | Recall (With Review) | +Recall |
|---|---|---|---|
| Original | 94.59% | 97.81% | +3.22% |
| Condensed | 87.60% | 95.00% | +7.40% |
| Typo Low | 76.83% | 86.39% | +9.56% |
| Typo Medium | 68.89% | 78.92% | +10.03% |
| Typo High | 63.01% | 71.08% | +8.07% |
Figure 15: Impact of the Review Pass agent across text variants.
The Review Pass adds up to +10 percentage points on noisy text, but nearly doubles both latency and inference cost. For clean text, the +3% gain doesn't justify 2x latency, so we disable it by default. For noisy or high-stakes documents, the gains may justify the latency increase.
We measured reproducibility across multiple independent runs using Multiple Intersection over Union (mIoU), where 1.0 indicates perfect reproducibility. The Data Engine shows exceptional consistency on clean data: Original text achieves mIoU 0.9856 and Condensed text 0.9189, confirming highly deterministic extraction.
For a hospital, this means the same note yields the same extracted data run after run—critical for audit trail and repeatable reporting.
Figure 16: Consistency Comparison between five EHR variants. The model shows near-perfect reproducibility on Original and Condensed datasets.
Typo noise reduces consistency gradually—from 0.8326 (Low) to 0.7731 (Medium) to 0.7005 (High)—underscoring the value of upstream OCR correction for degraded scans.
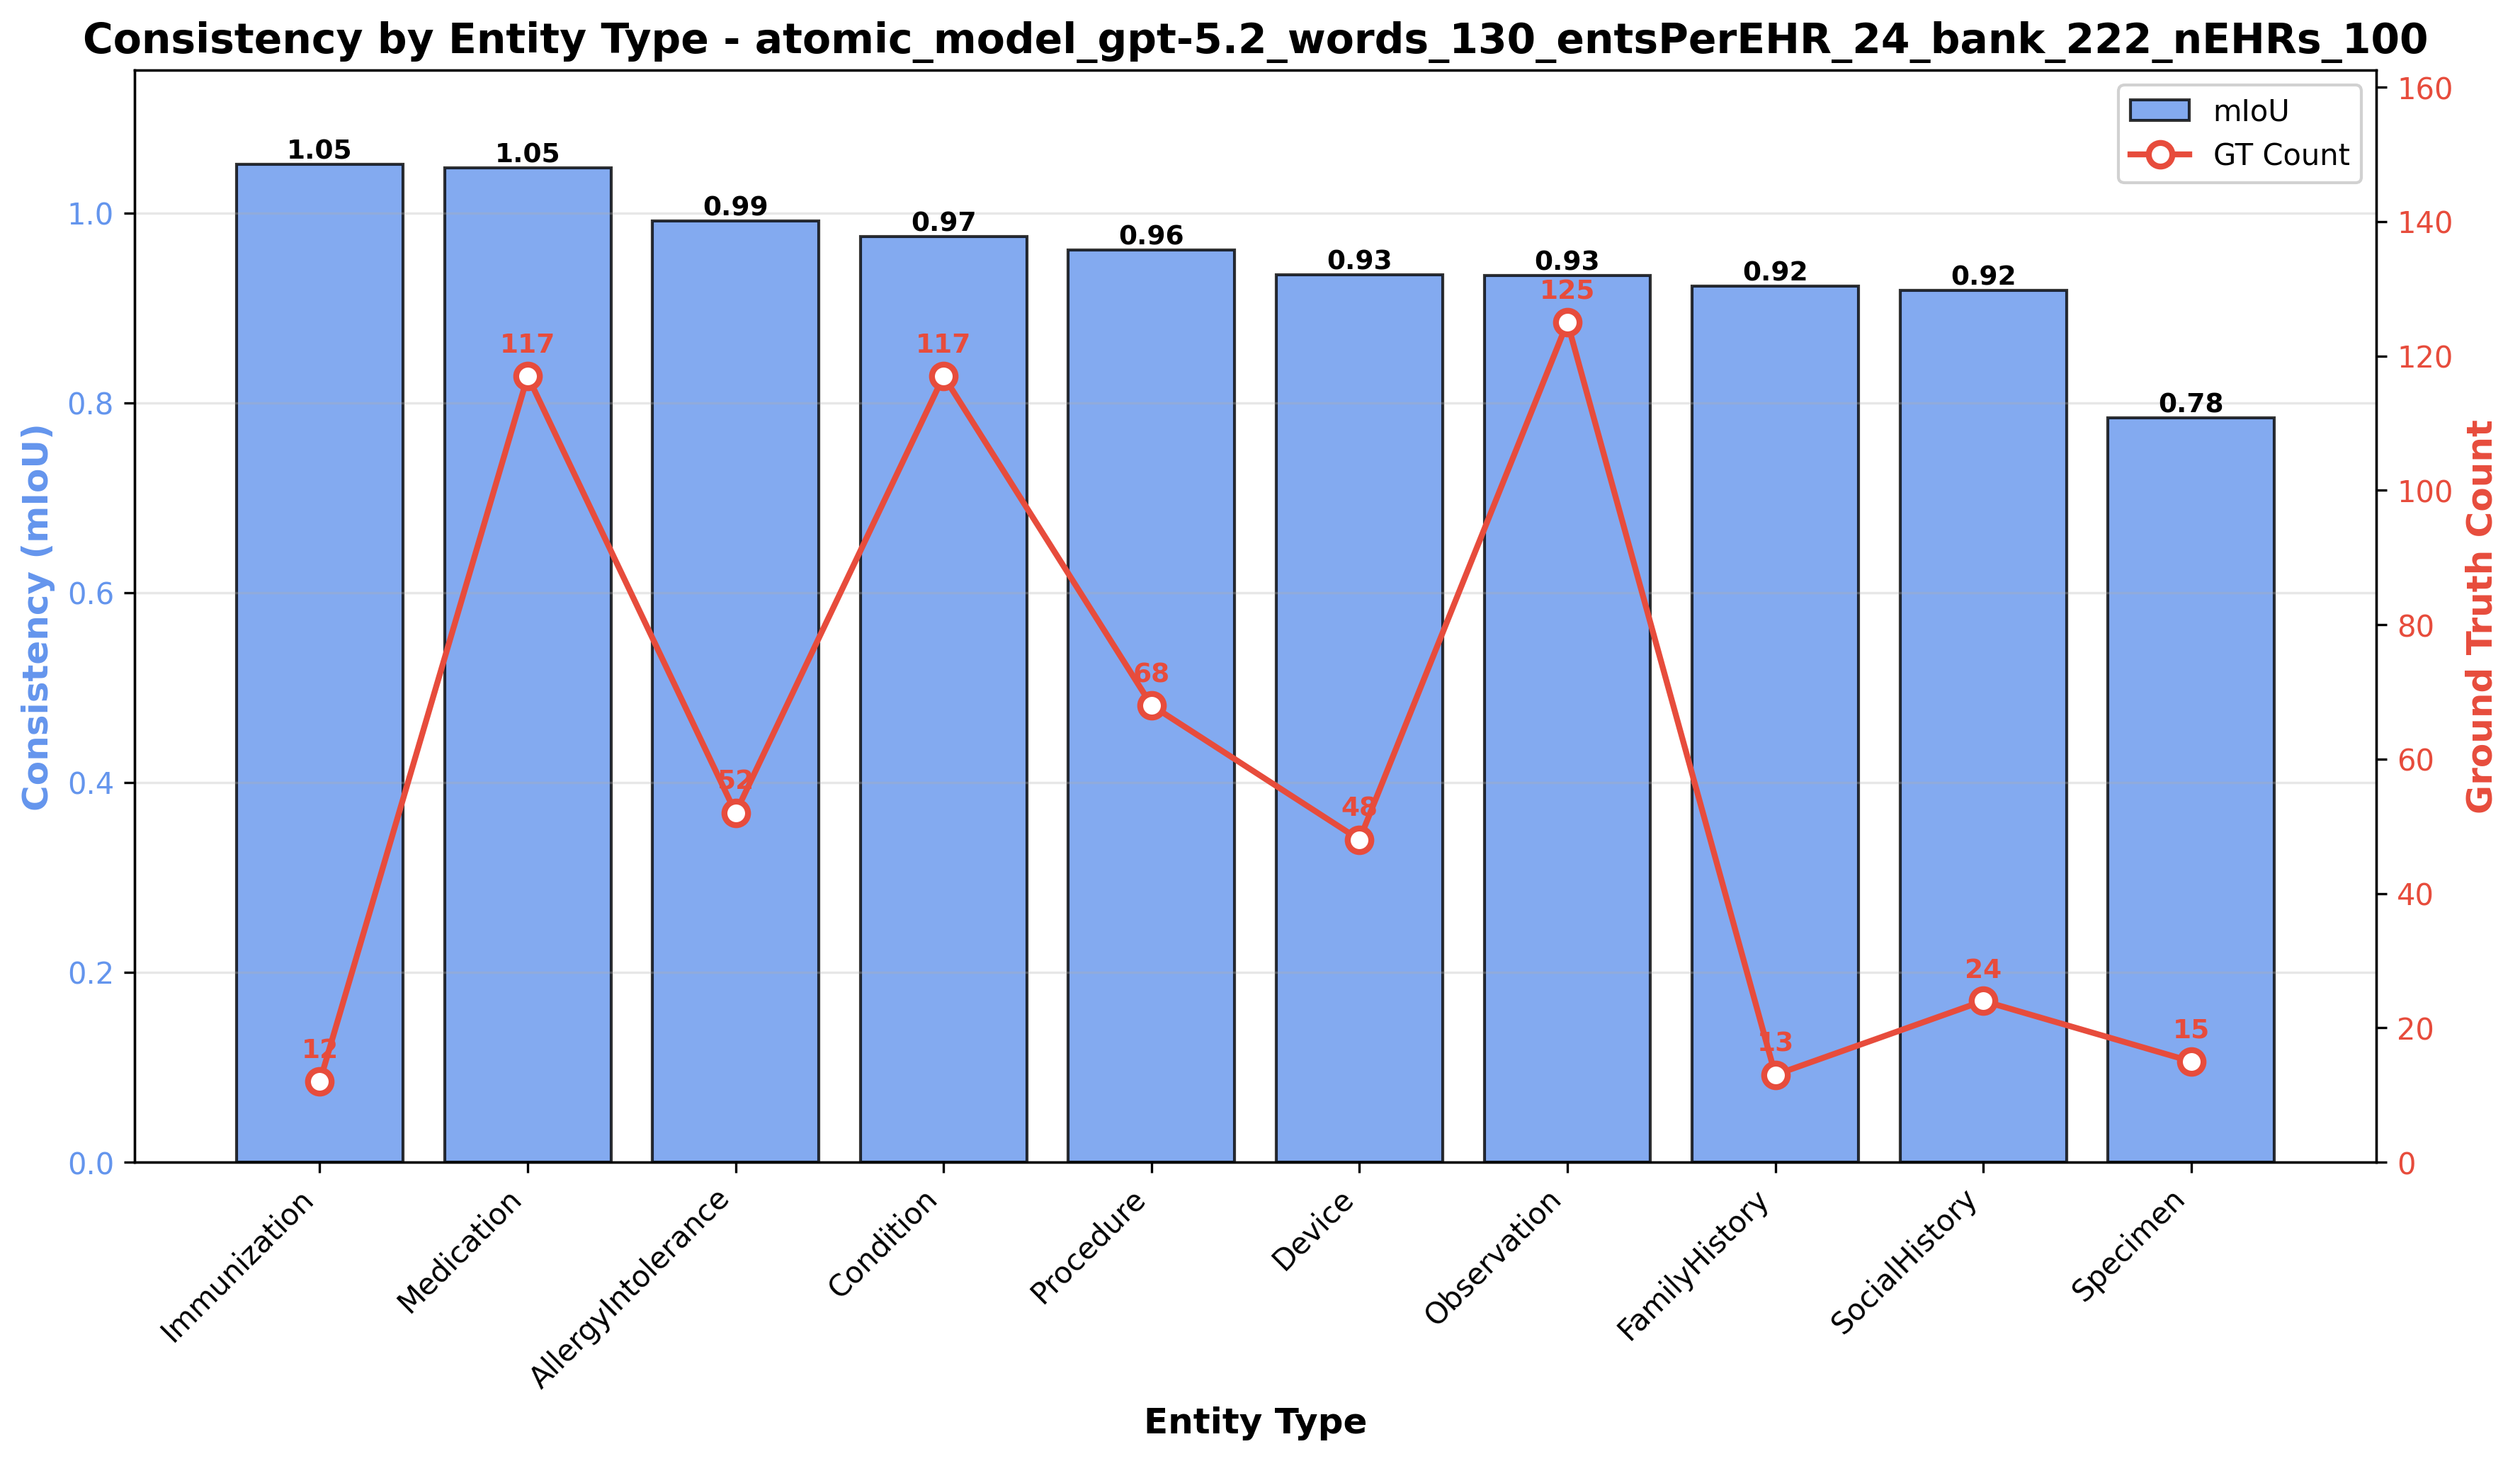
Figure 17: Consistency of clinical extraction per Clinical Category.
Beyond general entity recognition, the Data Engine must excel at extracting quantitative laboratory observations—capturing not just a concept name, but a precise triplet of (name, value, unit). We built a dedicated benchmark with heterogeneous formatting styles (bullet lists, inline prose, markdown tables) for lab result processing.
Following the same philosophy as our entity recognition benchmark, we generate synthetic EHRs with known ground truth lab values. The generation pipeline has four distinct phases:
Figure 18: Lab results benchmark data generation pipeline
Lab extraction requires a more nuanced evaluation than general entity recognition. We must verify that the extraction captures the complete clinical observation—not just the lab name, but also the value and unit.
Our lab results benchmark achieved 100% recall across 200 ground truth lab observations. The table below summarizes the results:
For a hospital, this means even the most information‑dense lab sections can be structured perfectly.
| Metric | Value | Description |
|---|---|---|
| Total EHRs | 10 | Synthetic clinical notes with heterogeneous lab formatting |
| Total Labs | 200 | Ground truth lab observations (20 per EHR) |
| Fully Matched | 200 | Labs where value+unit were correctly extracted |
Figure 19: Lab results benchmark summary. 100% recall demonstrates reliable lab extraction.
The following examples show real benchmark outputs. Hover over highlighted lab results to see the ground truth, extracted values, and match status.
Figure 20: EHR #1 with bullet-list formatting. Green = exact match, Yellow = value+unit match. Hover for details.
Beyond identifying which clinical entities appear in text, the Data Engine must correctly determine contextual attributes—such as whether a condition is negated, historical, or hypothetical. We evaluated this through a focused unit-style benchmark of 180 test cases.
The testing process is fully automated: a Teacher LLM generates clinical snippets with specific attribute assertions (Phase 1), the Data Engine processes them (Phase 2), and the system automatically verifies the output against the ground truth (Phase 3).
| Category | Example Input | Extracted Attribute |
|---|---|---|
| Negation | "Patient denies hypertension" | negated: true |
| Temporal Context | "Appendectomy in 2015" | context: HISTORICAL |
| Certainty | "Possible pneumonia" | certainty: SUSPECTED |
| Body Site | "Left wrist pain" | laterality: left |
| Recommendations | "Advised to start walking" | is_recommendation: true |
| Family History | "Mother has diabetes" | family_member: mother |
| Medication Status | "Discontinued lisinopril" | status: DISCONTINUED |
Figure 21: Examples of attribute extraction capabilities tested in the benchmark.
The benchmark demonstrated robust performance across key categories, with fundamental attributes achieving perfect scores.
| Category | Pass Rate |
|---|---|
| Body Site Laterality | 100% |
| Negation | 100% |
| Temporal Context | 100% |
| Certainty | 100% |
| Recommendations | 100% |
| Family History | 80% |
| Medication Status | 75% |
Figure 22: Pass rates for key attribute categories.
Negation, Temporal Context, Certainty, Body Site, and Recommendations all achieved 100% accuracy. These are the most critical attributes for correct clinical interpretation, ensuring that past history is not mistaken for active conditions and that ruled-out diagnoses are not coded as present.
For a hospital, this means the engine preserves clinical meaning (e.g., “rule out” vs. “diagnosed”), reducing the risk of incorrect coding, quality flags, and downstream analytics errors.
Family History (80%) and Medication Status (75%) showed strong performance with minor deviations. A detailed analysis revealed that the majority of these "failures" were due to valid simplifications or vocabulary mismatches in the ground truth rather than extraction errors.
PRESCRIBED, which is trivial to improve.Overall, the results confirm that the Data Engine is highly reliable for the core attributes required for downstream clinical reasoning.
To validate that Striata can reliably answer real hospital analytics questions, we built a comprehensive benchmark suite. The suite contains 36 questions spanning the kinds of analyses that hospital administrators, quality teams, and clinical researchers routinely need—run against a synthetic EHR dataset of 60,000 patients.
Each benchmark question is given to Striata with no human assistance. The system must autonomously: (1) write SQL to extract the right patient cohort from the database, (2) generate and execute Python code to perform the analysis, and (3) produce a written insight summarizing the findings. We then automatically validate whether the correct data was extracted and the correct conclusions were reached.
Questions are organised into families, where each family explores a single clinical topic at four levels of increasing difficulty. This tests whether Striata can handle not just simple lookups, but also multi-layered stratifications and statistical modelling. Here is an example from one family:
The full benchmark spans nine such families across two categories:
For each question, we automatically check two things:
To make this concrete, here is exactly what Striata produced for a single Level ii question — with no human guidance at any step.
Figure 24: End-to-end walkthrough of a single benchmark question. Striata autonomously selects the right tables, extracts a patient cohort, chooses a statistical method, and produces a written conclusion.
Across both categories, Striata successfully completed every question—producing a valid data extraction, statistical analysis, and written summary for all 36 questions without any human intervention.
For a hospital, this means managers can finally ask the questions that have been bothering them for years - and improve pathways and operations based on evidence, not gut feel.
| Benchmark run | Questions | Success rate | Median time per question |
|---|---|---|---|
| Category 1A (descriptive) | 12 | 100% | ~3.3 minutes |
| Category 1B (inferential) | 24 | 100% | ~4.2 minutes |
Figure 25: Striata benchmark results across 36 questions on a 60,000-patient synthetic EHR dataset. Every question completed successfully.
Currently, our focus is reducing the median time per question to under one minute and expanding the benchmark to additional use cases, including:
The combined product story is simple: the Data Engine standardizes messy clinical text into interoperable data, and Striata turns that data into answers. A question asked in plain language becomes a clear cohort and explicit analysis that can be repeated and audited.
We believe progress in healthcare depends on shortening the distance between question and evidence without lowering the standard of proof. That is why benchmarking is a constraint: improvements only count when reliability, latency, and correctness move in measurable ways.
Striata is designed to be inspectable, not a black box: for each answer, users can review the reduced dataset used for the computation and the analysis code that produced the result—and iterate conversationally with follow-ups to refine criteria and dig deeper without restarting from scratch.